Table of Contents
Histogram
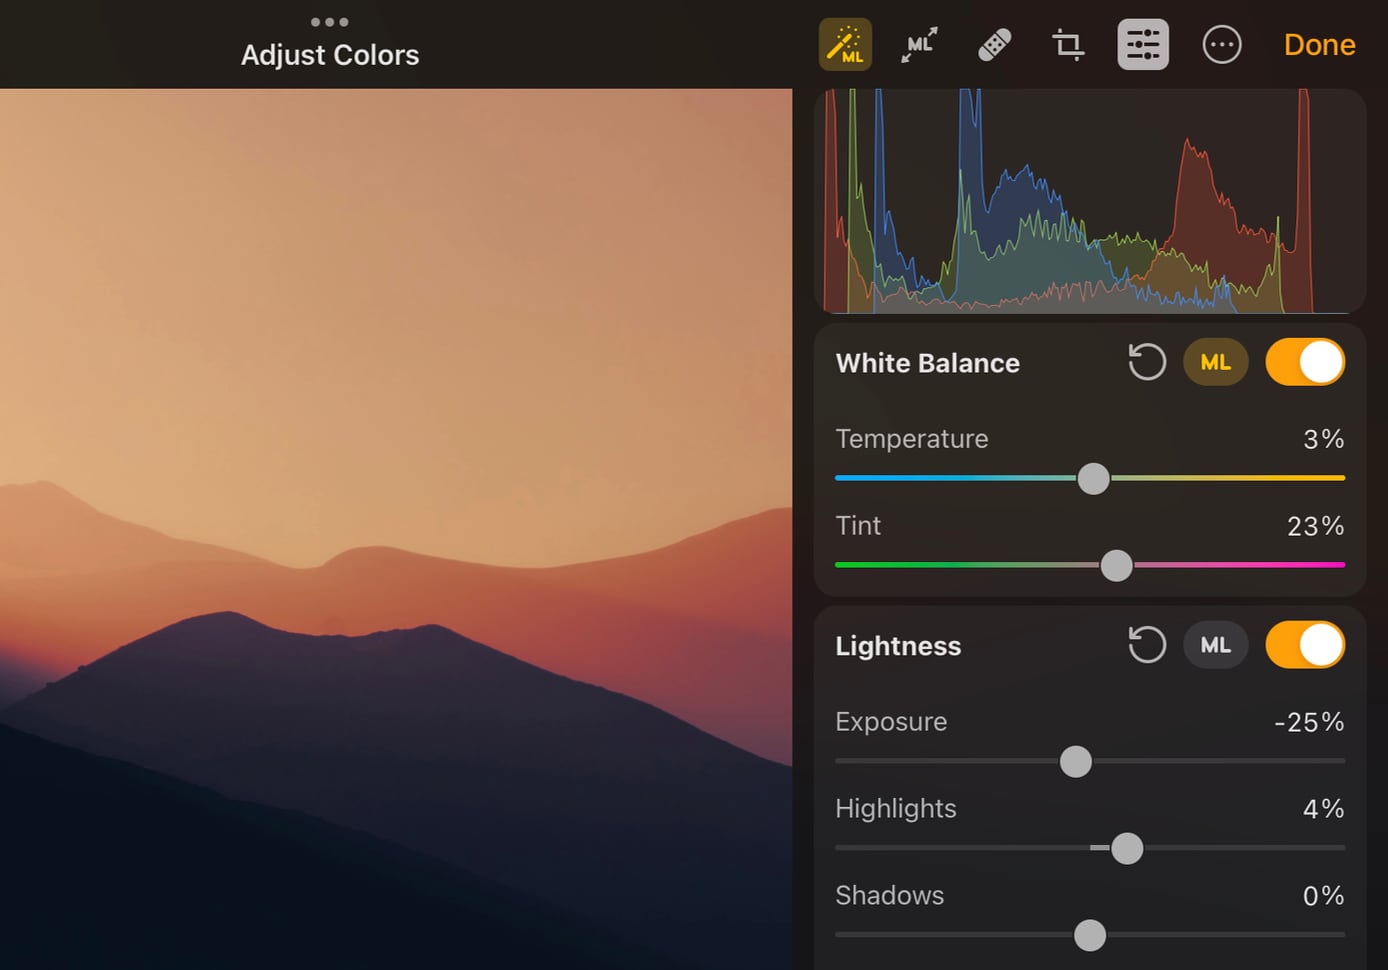
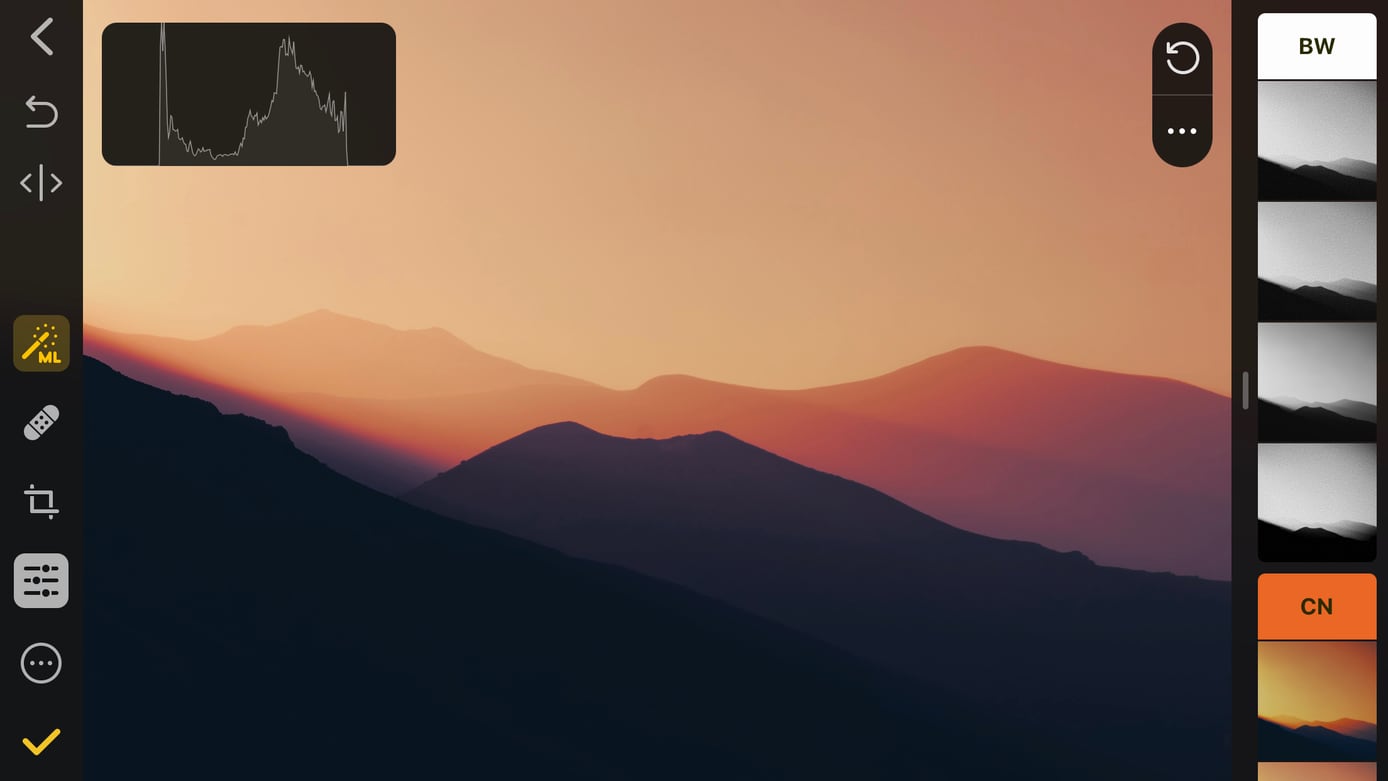
A histogram is a handy tool that provides information about the distribution of colors in an image, in other words, displays its tonal range. The image tones can range from pure black on the left edge to pure white on the right edge of the histogram. So, what you have to pay attention to if you want to learn how to read a color histogram is the shape of the graph and where the peaks of the graph are.
Put simply, the higher the graph is at a given point, the more of a certain tone there is in an image. Therefore, considerably dark images with lower exposure and a lot of shadows will have a graph that peaks on the left side, while brighter images will have a histogram that is higher on the right side.
Show or hide the histogram
Show or hide the histogram:
Tap to select Color Adjustments
 in the toolbar.
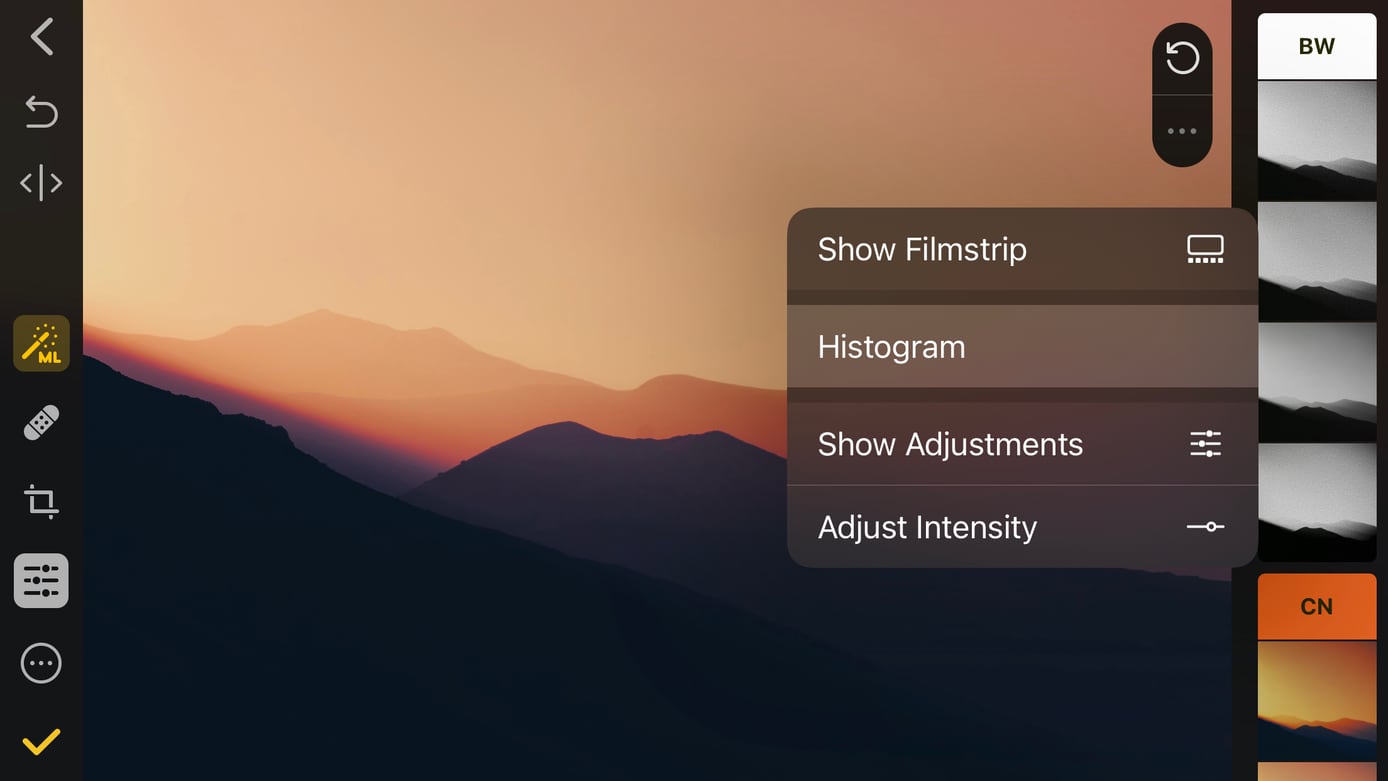
If the histogram isn't visible, tap More at the bottom of the Color Adjustments pane and tap Histogram.
Choose how to display the histogram:
- Visible — Displays histogram at all times at the top of the Color Adjustments pane.
- Auto-hide — Automatically hides or shows the histogram as you work in Split View on iPad.
- Hidden — Turns the histogram off.
Show or hide the histogram
Show or hide the histogram:
Tap to select Color Adjustments
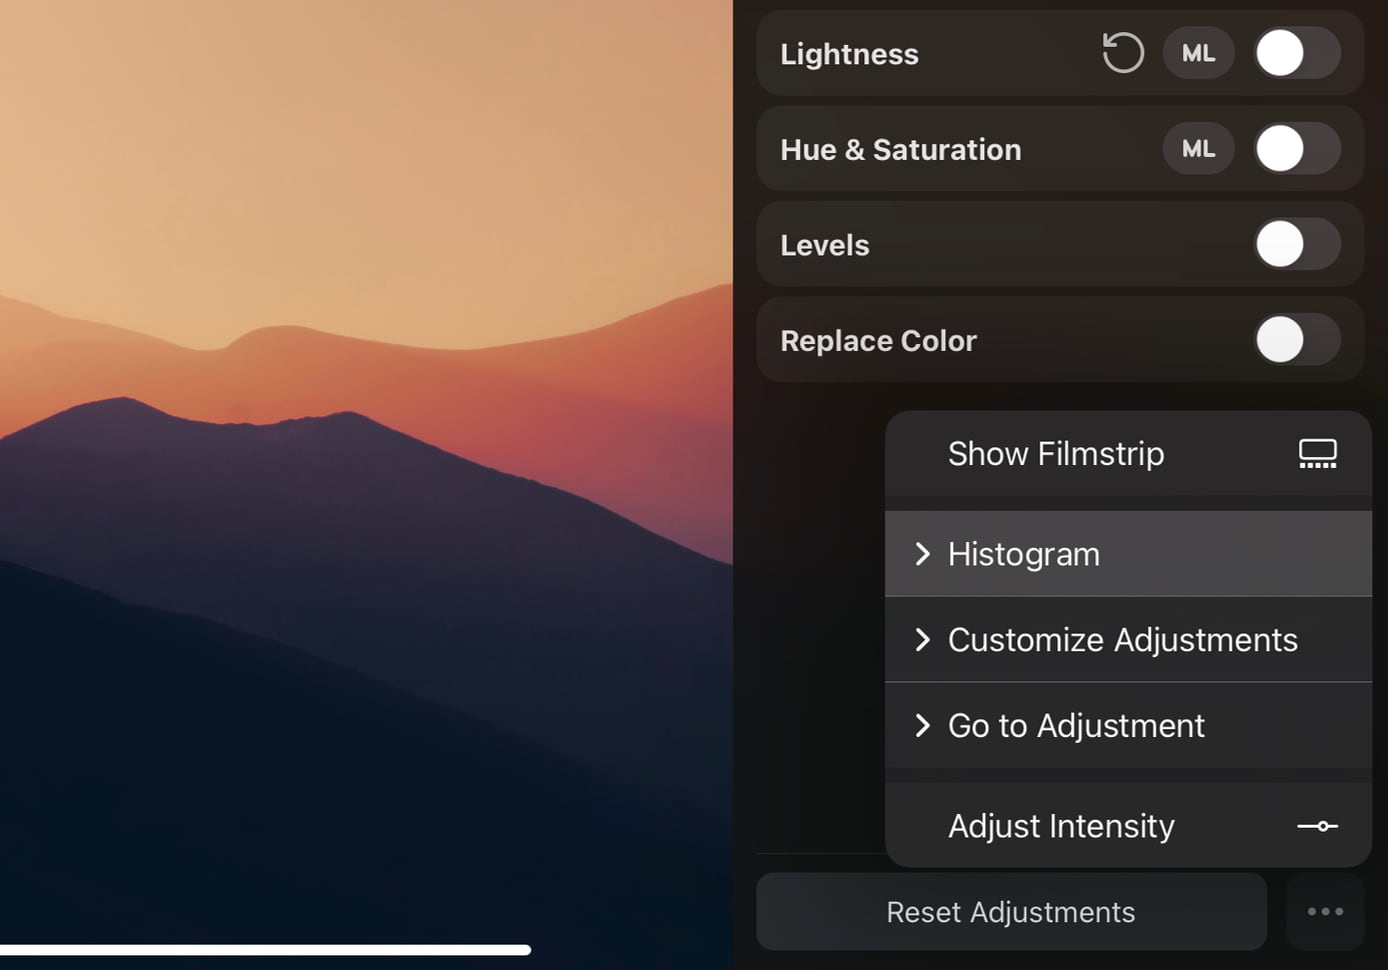
in the toolbar.If the histogram isn't visible, tap More next to the Color Adjustments pane and tap Histogram.
Choose how to display the histogram:
- Visible — Displays histogram at all times at the top of the Color Adjustments pane.
- Auto-hide — Automatically hides or shows the histogram when switching between presets and color adjustments.
- Hidden — Turns the histogram off.
Choose the histogram type
To choose a histogram type:
Tap to select Color Adjustments
in the toolbar.If the histogram isn't visible, tap More at the bottom of the Color Adjustments pane and tap Histogram.
Choose the histogram type:
- Luminance — The luminance histogram displays the perceived brightness of an image. It doesn’t look at the individual color channels but at the colors themselves. So, unlike in the RGB histogram, pure blue will not be at the far right edge of the luminance histogram. And the luminance histogram also takes into account the fact that the human eye perceives green light as naturally brighter than red or blue. So any pure green areas will show up further right than pure blue or pure red areas.
- RGB — An RGB histogram shows you all the tones in your image, from pure black on the left edge to pure white on the right edge of the histogram. The higher the graph is at a given point, the more of the tone is in the image. Therefore, a fairly dark image with lots of shadows will have a histogram that is higher on the left side (the shadows), while a fairly bright image will have a histogram that is higher on the right side (the highlights). The reason the histogram is known as an RGB histogram is that digital images are composed of a mix of three colors — red, green, and blue. These are used to create every other color.
Choose the histogram type
To choose a histogram type:
Tap to select Color Adjustments
in the toolbar.If the histogram isn't visible, tap More next to the Color Adjustments pane and tap Histogram.
Choose the histogram type:
- Luminance — The luminance histogram displays the perceived brightness of an image. It doesn’t look at the individual color channels but at the colors themselves. So, unlike in the RGB histogram, pure blue will not be at the far right edge of the luminance histogram. And the luminance histogram also takes into account the fact that the human eye perceives green light as naturally brighter than red or blue. So any pure green areas will show up further right than pure blue or pure red areas.
- RGB — An RGB histogram shows you all the tones in your image, from pure black on the left edge to pure white on the right edge of the histogram. The higher the graph is at a given point, the more of the tone is in the image. Therefore, a fairly dark image with lots of shadows will have a histogram that is higher on the left side (the shadows), while a fairly bright image will have a histogram that is higher on the right side (the highlights). The reason the histogram is known as an RGB histogram is that digital images are composed of a mix of three colors — red, green, and blue. These are used to create every other color.